Research has indicated diabetics have two to three times higher risk of infectious disease mortality than otherwise similar nondiabetics (1). Hyperglycemia (i.e., elevated blood glucose levels) has been hypothesized to specifically interfere with macrophage recruitment and effective immune response (2). This 2015 mouse study sought to understand the specific mechanisms by which diabetes increases mortality.
Diabetic and control mice were both infected with H1N1 influenza at an LD50 dose — that is, a dose expected to kill at least 50% of control mice. Over the next 10 days, 100% of diabetic mice died, compared to 60% of controls.
Notably, when other doses were tested, the estimated LD50 for diabetic mice was 1/100th that of control mice. In other words, the majority of diabetic mice would be killed when exposed to a dose 1/100th the size of that required to kill the majority of control mice.
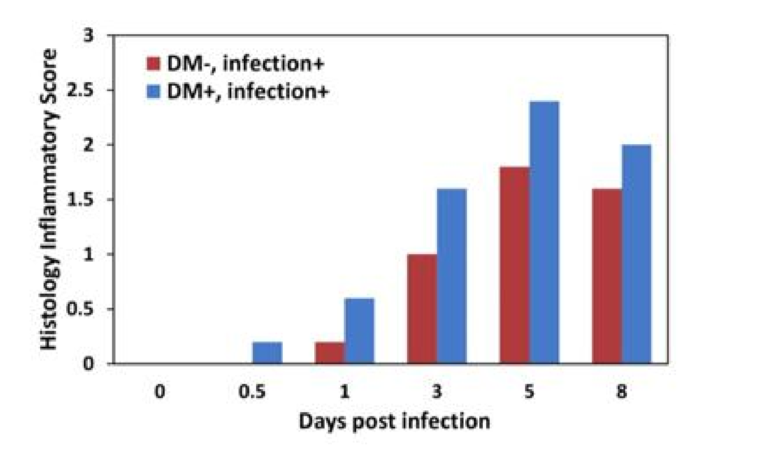
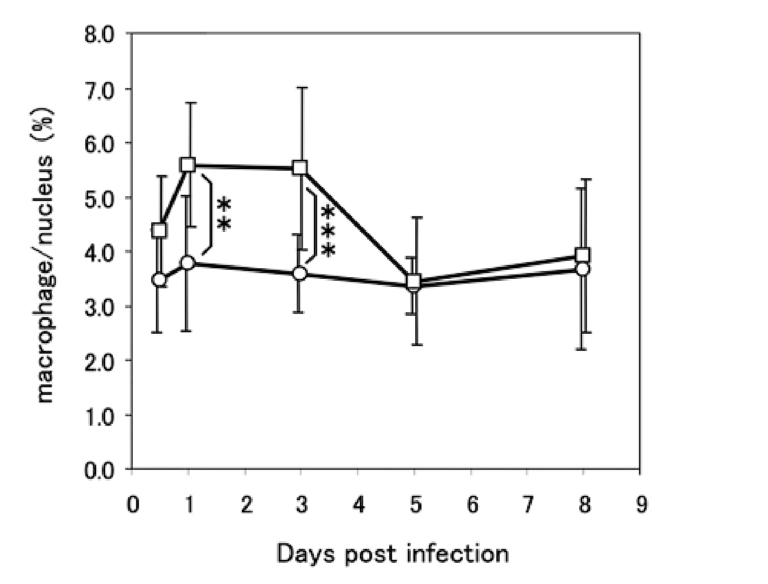
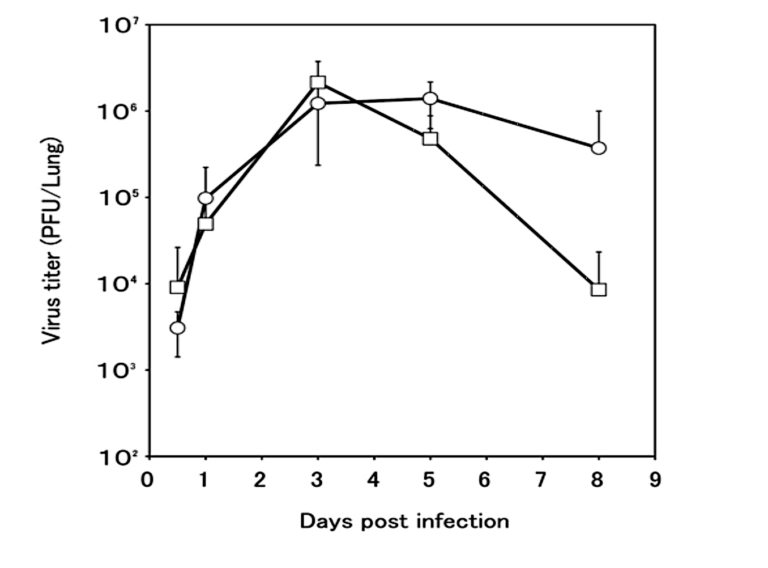
Closer inspection revealed profound differences in how diabetic and control mice responded to the infection. Compared to controls, inflammation levels were higher in diabetic mice at all checkpoints. Diabetic mice also failed to recruit macrophages to the lung — specifically, lung macrophage levels were constant at all checkpoints in diabetic mice, whereas controls exhibited a large increase in macrophage levels soon after infection. The viral load in the lungs increased similarly in diabetic and control mice over the first three days, but where control mice saw viral loads peak and then gradually decrease, viral clearance was significantly impaired in diabetic mice. These differences are illustrated in the figures below.

Figure 1: Inflammation levels were consistently higher in diabetic than nondiabetic mice.

Figure 2: Control mice (squares) recruited additional macrophages to the lung soon after infection, with macrophage levels decreasing back to baseline alongside decreasing viral load. Diabetic mice (circles) did not exhibit macrophage recruitment despite a similar increase in viral load. (See Figure 3)

Figure 3: Viral load increased similarly over the first three days in control and diabetic mice. After day three, viral load decreased in control mice (squares) while remaining elevated in diabetic mice (circles).
Taken together, this data demonstrates diabetic mice failed to mobilize macrophages in response to the infection, failed to clear virus from the lungs, and mounted a greater inflammatory response. While this is a mouse study and the results cannot be directly extrapolated to humans, it nevertheless reveals direct mechanisms by which diabetes may interfere with the body’s ability to have an effective response to viral infection and by extension demonstrates why diabetes increases risk of viral mortality.


